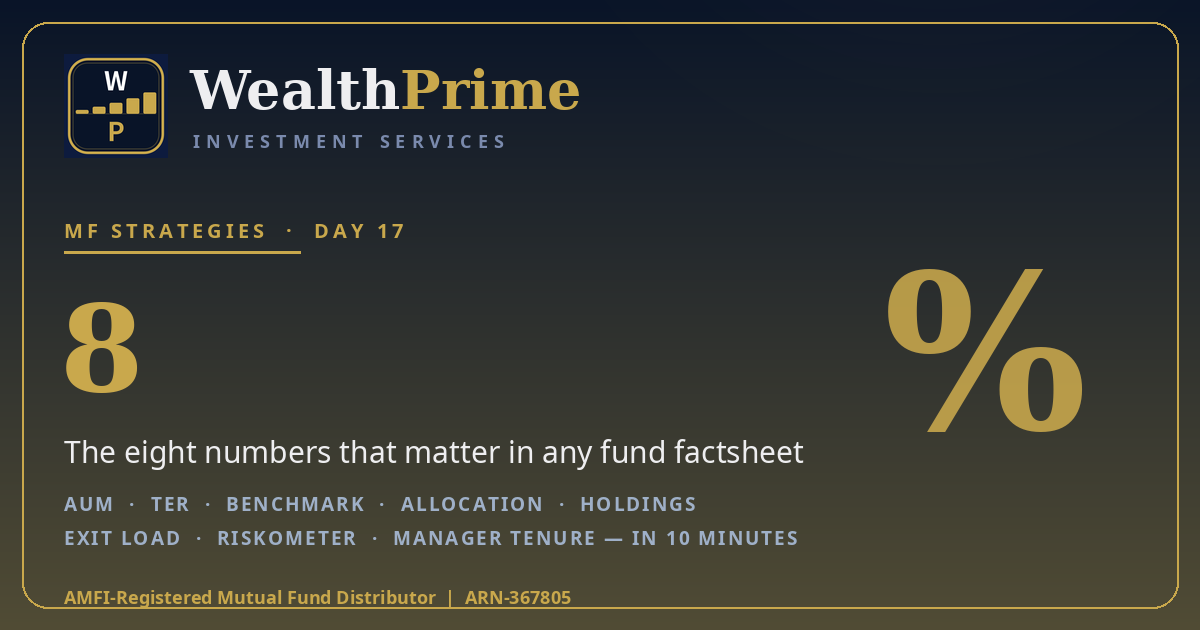
Every month, your fund house publishes a short document about your fund — two to four pages, free to download, and almost never read. That document is the factsheet, and it is the single most honest thing a fund ever tells you about itself.
A factsheet lists what the fund owns, what it charges, how it has performed against its benchmark, and how risky SEBI considers it. Once you know which numbers to look for, you can read any fund’s factsheet in about ten minutes. This post walks through the eight numbers that matter, shows what a 1.5% expense ratio costs on a ₹5 lakh corpus, and ends with a ten-minute routine for every fund you hold.
The 8 numbers that matter
Open any factsheet and you will find the same eight figures, in roughly the same places. Learn the list once, and every factsheet reads the same way.
1. AUM (assets under management). The total money in the fund, usually on page one. A very small fund can be costlier to run; a very large one can struggle to move nimbly in small-cap stocks. Size is context, not a verdict.
2. TER (total expense ratio). The annual charge, shown separately for the direct and regular plans. This is the number that quietly decides a large share of your outcome — the next section works out what it costs.
3. Benchmark. The index the fund is measured against, usually a Total Return Index (TRI) that includes dividends. A fund that beats its benchmark has added value; one that trails it for years has not. The benchmark is the honest yardstick — ignore comparisons against a fixed deposit or an unrelated index.
4. Asset allocation. How the fund splits its money — equity, debt, cash, and, for equity funds, the split across large-, mid- and small-cap stocks. This is the factsheet’s picture of what you own.
5. Top holdings. The fund’s biggest stock or bond positions, usually the top ten, with their weights. If they add up to more than half the fund, your money is concentrated in a few names — fine if you know it, a surprise if you don’t.
6. Exit load. What the fund charges if you sell early. Many equity funds charge 1% on redemptions within twelve months; liquid funds usually charge nothing after a few days. Read it before you invest, not when you need the money.
7. Riskometer. SEBI’s six-level risk scale — Low, Low to Moderate, Moderate, Moderately High, High, Very High — based on the portfolio the fund actually holds. It is the regulator’s view of how much the fund’s value can swing.
8. Fund manager and tenure. Who runs the fund and since when. A fund that changed managers twice in three years is a different fund from the one whose five-year record you admired.
One more number sits at the top of page one: the NAV, the price of one unit. If the NAV is ₹87.42 and you invest ₹50,000, you get 571.95 units (₹50,000 ÷ ₹87.42). A high NAV does not mean an expensive fund and a ₹10 NAV does not mean a cheap one; NAV is just the price per unit. Our direct vs regular plan guide explains why two NAVs exist for the same fund.
The expense ratio line — the most expensive line on the page
The TER is the factsheet’s most expensive line, because it is charged every year on your entire corpus, whether the fund rises or falls. A fund with a 1.50% TER takes ₹1,500 a year for every ₹1 lakh invested; one with a 0.30% TER takes ₹300. The gap looks small as a percentage. On a real corpus, it is not.
Take a ₹5 lakh corpus — the kind of sum a few years of SIPs builds — and read the TER line as a yearly bill:
The difference between the cheapest and the costliest line is ₹6,000 every year — ₹60,000 over ten years, before compounding is even counted. Compounding makes the real gap bigger, because every rupee paid in fees stops compounding for you. Our direct vs regular plan guide works out the compounded version: on a ₹10,000 monthly SIP, a 1% TER gap is worth ₹1,24,353 in ten years. The factsheet shows both TERs side by side, so the comparison takes ten seconds. If you want to test your own figures, the lumpsum calculator runs the same maths on any amount you choose.
Two cautions. First, compare TERs only within the same category: an index fund at 0.20% and an actively managed small-cap fund at 1.80% are not doing the same job. Second, a low TER never rescues a bad fund — it only makes a good fund cheaper to own. Cost is a filter, not a selection rule.
A factsheet is a fund’s report card, not its brochure. The eight numbers tell you what you own, what it costs and what it risks. Read those, skip the marketing, and you can judge any fund in ten minutes.
The portfolio pages: what the fund actually owns
Past the first page, the factsheet lists the portfolio — every holding, with weights. Three checks matter.
Concentration. Add up the top ten holdings. Below 40% is a diversified portfolio; above 60% is a concentrated bet on a few names. Neither is wrong — but a concentrated fund swings harder, and you should know that before a fall, not during one.
Sector bets. The factsheet shows the split across sectors — banks, IT, energy, pharma, and the rest. If two of your funds both hold 30% in banks, you own one big banking bet wearing two labels. That overlap check also spots two funds doing the same job — our large-, mid- and small-cap guide explains why one fund per bucket is usually enough.
Portfolio turnover. A single percentage showing how much of the portfolio changed in a year. A turnover of 30% means roughly a third of the holdings were replaced; 150% means the manager traded the whole portfolio one and a half times over. High turnover is not a sin — some strategies demand it — but trading costs come out of your returns, so if turnover is high and returns are ordinary, ask what the trading bought you.
Debt funds show different numbers: average maturity, yield to maturity (YTM), and the credit-rating split. A YTM well above its peers usually means lower-rated paper — the extra yield is the market paying you to take extra credit risk. Our debt funds vs FD guide covers those numbers.
The performance page: benchmark, returns and the riskometer
The performance table shows returns over one, three, five and ten years, next to the benchmark. Read it with two habits.
Compare against the benchmark, not against other funds. A fund returning 14% while its benchmark returned 16% underperformed, even if 14% sounds good. One returning 11% against a 9% benchmark added value. The benchmark is the only fair comparison, because it is the return of doing nothing clever at all.
Look at more than one period. One good year can be luck; three and five years of beating the benchmark is a pattern. If the factsheet also shows rolling returns — the return over every three-year window — give those more weight than the headline one-year number.
Below the returns sit the risk ratios: standard deviation (how much the returns wobbled), beta (how much the fund moves with the market — above 1 means it swings more than the market), and the Sharpe ratio (return per unit of risk taken). You do not need the formulae: a high standard deviation with ordinary returns means a bumpy ride for nothing, and a Sharpe ratio above 1 means the fund earned its volatility. Past performance is not indicative of future returns — the factsheet says so itself, and it is worth believing.
The riskometer deserves a second look. It is calculated from the portfolio, not chosen by the fund house, and it can change: a fund drifting from Moderately High to High is telling you its portfolio got riskier. A Very High riskometer is not a warning to avoid the fund — small-cap funds wear it honestly — but it is a promise that the ride will be rough.
The fine print: exit load, manager tenure, and red flags
The last page carries the details that decide whether a fund is easy to live with. The exit load you already know — check it again here, because it is the number that bites when you need money in a hurry.
Manager tenure and fund size. A manager with five years or more through a full market cycle has a record you can judge; a fund that changed managers last quarter has a record that belongs to someone else. On size, a very small fund may carry a higher TER and be harder to exit in a stress, while a very large fund in a narrow category may struggle to deploy new money. Neither is a deal-breaker — both are worth knowing.
Red flags. Four things should make you pause: a TER that jumped sharply from last year’s factsheet; a category that no longer matches the holdings; a top holding that dominates without explanation; and a factsheet that is hard to find at all. Any one is a reason to ask questions, not to panic — but none should be ignored. You can check any fund’s live expense ratio, category and holdings in the explorer and compare them with the factsheet in front of you.
Your 10-minute walkthrough
The routine, start to finish, for any fund you hold or are considering:
Minutes 0–2: page one — AUM, direct and regular TERs, benchmark, riskometer. If the TER is high for its category, or the riskometer higher than you expected, that alone may settle the question.
Minutes 2–5: the portfolio — check the allocation split and add up the top ten holdings, noting any single stock above 8–10% or any sector above a third of the fund.
Minutes 5–8: performance — compare the three- and five-year returns with the benchmark. One bad year is noise; three years of trailing it is a pattern.
Minutes 8–10: the fine print — exit load, manager tenure, turnover. Then file the factsheet away and repeat once a year — or whenever the manager changes, the TER jumps, or the riskometer moves.
Ten minutes, once a year, per fund — the difference between owning a fund and merely holding one.
Frequently asked questions
Where do I get a fund's factsheet?
Every AMC publishes its factsheets free on its own website, usually within about ten days of the month-end, and AMFI also links them. Search for the fund name plus ‘factsheet’ and you will find the latest monthly PDF. The explorer lists the same figures — expense ratio, category and holdings — for any fund, if you want a quick check without opening the PDF.
What is a good expense ratio?
It depends on the category. Index funds usually charge 0.10% to 0.30% a year, while actively managed equity funds commonly charge 1% to 2%. Compare a fund’s TER only against funds in the same category, and compare the direct and regular plans of the same fund — the gap between them is the distributor’s commission, and on a ₹10,000 monthly SIP a 1% gap is worth an illustrative ₹1,24,353 over ten years.
What does the riskometer actually tell me?
The riskometer is SEBI’s six-level scale — Low, Low to Moderate, Moderate, Moderately High, High and Very High — calculated from the portfolio the fund actually holds. It tells you how much the fund’s value can be expected to swing, not whether the fund is good or bad. A Very High reading on a small-cap fund is honest, not alarming — but it is a promise that the ride will be rough.
How often should I re-read a factsheet?
Once a year at your portfolio review is enough for most funds — the factsheet itself changes monthly, but the numbers that matter move slowly. Re-read it sooner if the fund manager changes, the expense ratio jumps, the riskometer moves, or the fund’s category no longer matches what it holds.
The bottom line
A factsheet is the one document where a fund cannot hide: eight numbers — AUM, TER, benchmark, allocation, top holdings, exit load, riskometer and manager tenure — tell you what you own, what it costs and what it risks. The worked example puts a price on the most important of them: on a ₹5 lakh corpus, a 1.50% TER costs ₹7,500 a year against ₹1,500 at 0.30% — a ₹6,000-a-year difference, or ₹60,000 over ten years before compounding. Read the factsheet with the ten-minute routine — page one, portfolio, performance, fine print — and repeat it once a year, or whenever the manager, the TER or the riskometer changes. Ten minutes a year is a small price for knowing exactly what your money is doing. If you want to see the figures for the funds you hold, you can check any fund’s live expense ratio, category and holdings in the explorer before your next review.
Sources: SEBI mutual fund categorisation circular (2017); SEBI riskometer framework; AMFI factsheet disclosure norms. All ₹ figures are the author’s calculations at the stated assumptions — an illustration, not a forecast or guarantee. Rules as of 16 Nov 2026 and can change.
Still Not Sure What Your Funds Actually Hold?
A factsheet tells you what you own — but turning that into a portfolio that fits your goals is the harder part. Talk to us on a free, no-pressure call about a simple annual factsheet check for the funds you already hold.
Prefer chat? WhatsApp us