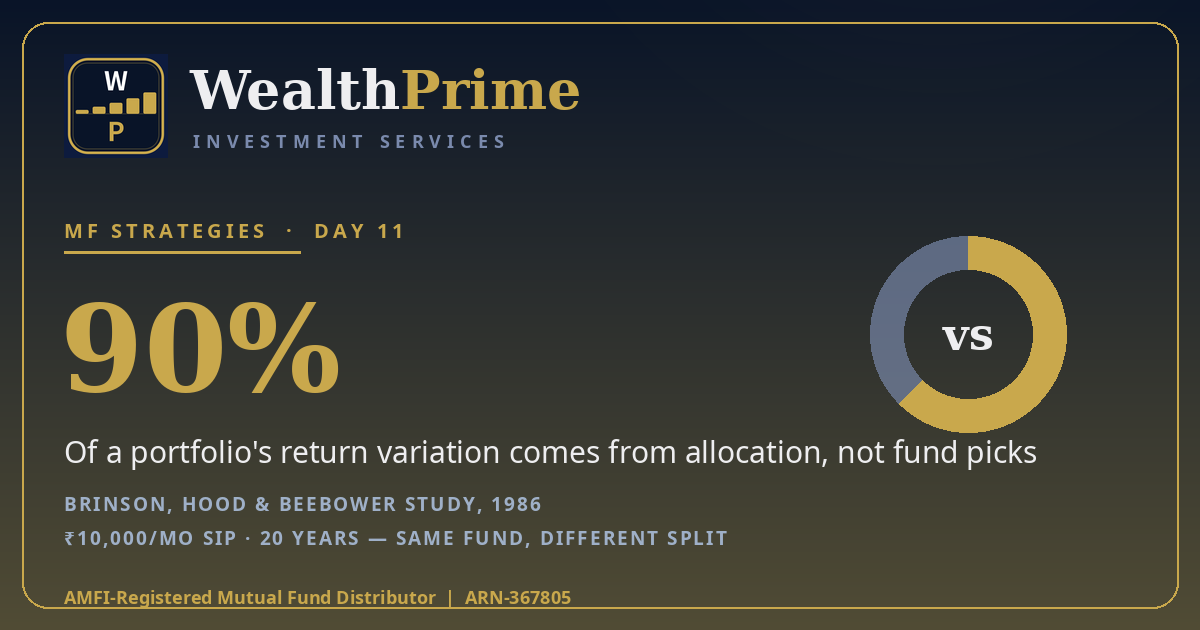
Two investors buy the same mutual fund. They start on the same day, invest the same ₹10,000 a month, and never miss an instalment. Twenty years later, one portfolio is worth roughly ₹28 lakh more than the other. The fund was identical — so what made the difference? The answer is the part of investing almost nobody talks about at the dinner table: asset allocation, the split of money between equity, debt and gold decided before a single fund is ever picked.
This article explains what asset allocation is in plain words, why research says it matters more than picking the “right” fund, and how the split changes what the same SIP builds over 20 years — with the maths shown, the assumptions stated, and nothing promised.
What asset allocation actually means
Asset allocation is the decision about how much of your money sits in each type of asset — mainly equity (shares and equity mutual funds), debt (fixed deposits, bonds and debt funds), and gold — before you choose any specific product. A 70:30 portfolio means 70% in equity and 30% in debt. The numbers always add to 100, and they describe the whole portfolio: your SIPs, your FDs, your PPF, everything together. Two people can hold the same fund and have completely different allocations, because allocation is about the mix, not the ingredients.
Each asset plays a different role:
- Equity is the growth engine. Over long periods it has tended to outpace inflation by the widest margin, but it is also the most volatile — a 20% fall in a bad year is normal, not a malfunction.
- Debt is the stabiliser. It earns a steadier, lower return and barely moves when markets fall, which is exactly what money needed in the next few years requires.
- Gold is the hedge. It often moves differently from both equity and debt, so a small slice — usually 5% to 10% — can soften the portfolio in years when the other two struggle.
Notice what allocation is not: it is not a fund, not a stock tip, and not a prediction about next year. It is a plan for how much of a fall you are willing to sit through, and how much growth you need, written down before the market tests either.
Why the split matters more than the fund
In 1986, three researchers — Gary Brinson, Randolph Hood and Gilbert Beebower — studied 91 large American pension funds and asked a simple question: what actually explained the difference between one portfolio’s returns and another’s? Their answer, published in the Financial Analysts Journal, was striking: the asset allocation policy — the split between stocks, bonds and cash — explained 93.6% of the variation in quarterly returns. Later research, including a well-known 2000 study by Roger Ibbotson and Paul Kaplan, put the figure at around 90% of the variability of returns over time. In plain words, most of the difference between one portfolio’s outcome and another’s came from how much sat in each asset class, not from which fund was picked inside each class.
That does not mean fund choice is irrelevant. A fund with high costs or a muddled strategy can still drag a portfolio, and checking a fund’s expense ratio and category in a factsheet is always worth doing. But it does mean the order of decisions is wrong for most beginners: they spend weeks comparing funds and five minutes — usually zero — deciding the split. The split is the decision that sets the range of outcomes; the fund picks only fine-tune inside it.
There is a second reason the split matters, and it is the one the studies cannot measure: behaviour. A portfolio built for someone else’s risk appetite is a portfolio you abandon in the first real fall. Allocation is the part of investing that is really about you — your goals, your income stability, and how much of a drop you can watch without selling.
The worked example: one SIP, three splits, 20 years
Take a ₹10,000 monthly SIP for 20 years — ₹24 lakh invested in total. The SIP is identical in all three cases; only the split changes. For the illustration, assume equity earns 12% a year and debt earns 7% a year — assumptions, not forecasts — and blend them by the split. A 70:30 portfolio therefore earns an assumed blended 10.5% a year (70% of 12% plus 30% of 7%), and a 50:50 portfolio earns an assumed blended 9.5%.
| Portfolio split | Assumed blended return | Value after 20 years |
|---|---|---|
| 100% equity | 12.0% p.a. | ₹99.91 lakh |
| 70% equity, 30% debt | 10.5% p.a. | ₹81.76 lakh |
| 50% equity, 50% debt | 9.5% p.a. | ₹71.76 lakh |
The gap between the all-equity portfolio and the 50:50 portfolio is about ₹28.16 lakh — larger than the entire ₹24 lakh invested. That is the price of the smoother ride: the 50:50 portfolio would have fallen far less in every market crash along the way, and its owner was far more likely to still be invested at year 20. The chart shows the three outcomes:
Read the chart as a trade-off, not a ranking. The all-equity bar is the tallest only because the illustration assumes equity earns more — and assumes the investor never panics and never needs the money early. If either assumption breaks, the tallest bar is the first to be abandoned. The right split is the one you can hold through a bad year without losing sleep or stopping the SIP.
An age-and-goal illustration, not a prescription
Allocation is usually set by two things: how long the money can stay invested, and how much of a fall you can watch without selling. The longer the horizon, the more equity the portfolio can carry, because equity has time to recover from falls. The table below shows illustrative starting splits for three ages — examples for discussion, not recommendations:
| Investor | Years to the goal | Equity | Debt | Gold |
|---|---|---|---|---|
| Age 30 | 25+ years | 70% | 25% | 5% |
| Age 45 | ~15 years | 55% | 35% | 10% |
| Age 55 | ~5 years | 35% | 55% | 10% |
Two details matter more than the exact numbers. First, the goal decides, not the age: money needed in two years for a house deposit sits in debt whatever your age, because two years is too short for equity to be relied on. Second, these splits are starting points — your income stability, the EPF and PPF you already hold (both count as debt in the mix), and your comfort with falls all move them. A 30-year-old with an unstable income may reasonably hold more debt than the table suggests; a 55-year-old with a pension and no loans may hold more equity.
Why two investors in the same fund get different outcomes
Take two investors with ₹10 lakh each, both holding the same flexi-cap fund as their equity portion. One holds 90% equity and 10% debt; the other holds 60% equity and 40% debt. Equity falls 20% in a bad year and debt stays flat. The 90:10 portfolio falls 18% to ₹8,20,000. The 60:40 portfolio falls 12% to ₹8,80,000 — a ₹60,000 difference on the same fund, in the same year, purely from the split. The first investor’s fund did nothing wrong; the allocation decided how much of the fall reached them.
The second difference is behaviour, and it is the bigger one. The investor who watches ₹1.8 lakh vanish is more likely to stop the SIP or redeem at the bottom — and the damage from selling low dwarfs the damage from the fall itself. The allocation that lets you stay invested through a bad year is usually worth more than the allocation that looks best on a spreadsheet. This is also why the emergency fund comes first: money for a job loss or a hospital bill must sit outside the investment portfolio entirely, as our emergency fund guide explains, so a crisis never forces you to sell investments at the worst moment.
Set the split before you pick the fund
Work in this order. First, list your goals with dates — a house deposit in two years, a child’s education in ten, retirement in twenty-five. Second, sort the money by horizon: under three years goes to debt, three to seven years to a mix, beyond seven years can carry mostly equity. Third, count what you already hold: EPF, PPF and FDs are all debt in the mix, so a salaried investor often already owns more debt than they think. Fourth, and only now, pick funds inside each bucket — you can compare flexi-cap funds in the fund explorer to see how the equity bucket can be built, category by category, with facts and no rankings. Fifth, review the split once a year and nudge it back when a good year has pushed equity far above target.
Before choosing any fund, it helps to know the number the split is serving. Run your own figures on our retirement calculator — it turns a monthly-expense figure into a corpus target and the SIP that funds it — and if you want the same working for a nearer goal, our retirement corpus guide walks through the maths step by step. Then the fund choice becomes what it should have been all along: a detail, not the decision.
Your allocation decides the range of outcomes; the fund you pick only fine-tunes inside it. Set the split first — by goal and horizon — and the fund choice gets dramatically easier.
Frequently asked questions
What is a good asset allocation for a beginner?
There is no single right answer — it depends on your goal’s horizon, your income stability, and how much of a fall you can watch without selling. A common starting point for a goal more than 10 years away is 60% to 70% in equity and the rest in debt, with 5% to 10% in gold as an optional diversifier. Build the emergency fund first, set the split by goal, and only then choose funds inside each bucket.
How often should I rebalance my portfolio?
Once a year is enough for most investors, or sooner if any bucket has drifted 5 or more percentage points from its target — for example, equity growing from 70% to 78% after a strong year. Rebalancing is usually done by switching units between funds or directing fresh SIPs to the underweight bucket. Remember that switching out of a fund can trigger capital gains tax, so check the tax treatment as of the date you act — rules can change.
Does asset allocation guarantee better returns?
No. Asset allocation manages risk and keeps you invested; it does not promise higher returns. The research finding is about explaining differences between portfolios, not a guarantee for any one investor. Equity can underperform debt for years, gold can fall too, and no split removes market risk — it only sizes the fall you have signed up for. Past performance is not indicative of future returns.
Should gold be part of every portfolio?
Not necessarily. Gold earns a place as a diversifier — it often moves differently from equity and debt — which is why a small 5% to 10% slice is common. But it is not a growth engine: over long periods it has tended to lag equity, and for short horizons its price swings can surprise. Investors who want gold exposure usually use sovereign gold bonds or gold funds rather than jewellery, so the holding stays liquid and easy to value.
The bottom line
Two investors can hold the same fund and end up ₹28 lakh apart after 20 years on identical ₹10,000 monthly SIPs — not because one picked better, but because one’s split carried more equity and the other’s carried more ballast. Research going back to Brinson, Hood and Beebower in 1986 says the split explains around 90% of the variation in portfolio outcomes, and the worked example shows why: the same SIP becomes ₹99.91 lakh at an assumed 12% all-equity return, ₹81.76 lakh at a 70:30 split, and ₹71.76 lakh at 50:50 — illustrations only, never promises. Set the split by goal and horizon, count the EPF and PPF you already hold, and let the fund choice come last.
Sources: Brinson, Hood & Beebower, “Determinants of Portfolio Performance”, Financial Analysts Journal, 1986 — asset allocation policy explained 93.6% of the variation in quarterly returns across 91 large pension funds; Ibbotson & Kaplan (2000) — around 90% of return variability over time; SEBI mutual fund categorisation circular (Oct 2017). SIP figures are the author’s calculations at assumed returns of 12% p.a. (equity) and 7% p.a. (debt), labelled illustrative — actual returns vary and are never certain. Past performance is not indicative of future returns. Rules as of 10 Nov 2026 and can change.
Set Your Split Before You Pick a Fund
Allocation decides the range of outcomes; the fund only fine-tunes inside it. Talk to us on a free, no-pressure call about a split that fits your goals, your horizon, and your comfort with market falls.
Prefer chat? WhatsApp us